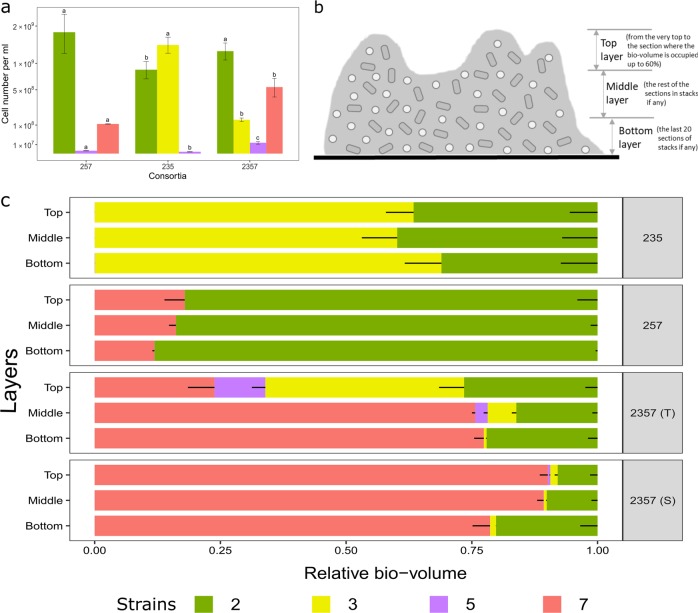
Fig. 2.
Cell numbers and distribution of individual species in triple-species and four-species biofilms cultivated for 24 h. a Individual species show distinct cell densities in different communities, however total cell numbers are not significantly different. b Top, middle, and bottom biofilms layers are defined as follows: Top layer is defined from the very top to the section where the bio-volume is occupied up to 60%; bottom layer is defined as the last 20 sections of stacks if any; middle layer is defined as the rest of the sections in stacks if any. c The relative bio-volume of pixels from each species is plotted in three defined layers (top, middle, and bottom) of biofilms. 2; S. rhizophila, 3; X. retroflexus, 5; M. oxydans and 7; P. amylolyticus. 2357 (S) and 2357 (T) represent local regions with scant (S) and typical (T) presence of M. oxydans (5) in the four-species biofilm, respectively. Strain 5 is not visible in consortia 235 and 257, because it is present in extremely low density (Supplementary Fig. 5; Supplementary Table 1). Error bars represent standard error of the mean of three biological replicates (n = 3)

