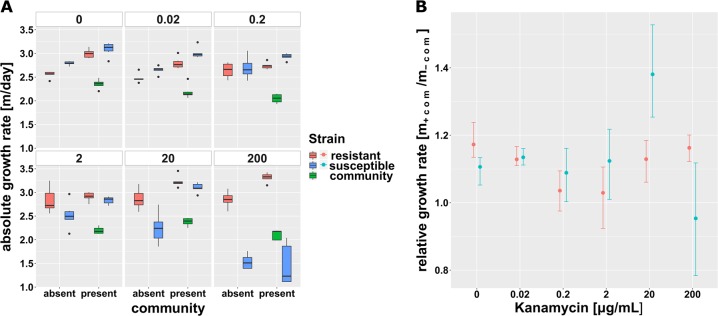
Fig. 3.
Malthusian growth parameter per day of the focal species’ isogenic strains for kanamycin. Values are displayed across the antibiotic gradient and in absence and presence of the gut microbial community. a Average (±SD, n = 6) logarithmic absolute growth per day for the resistant (red), the susceptible strain and the community. A different inoculum size of the focal species in absence (~106 bacteria) and presence (~105 bacteria = 10% of total inoculum) of the community was used. b Ratio of absolute Malthusian growth parameters (with 95% confidence intervals based on 1000-fold bootstrap analysis) in the presence and absence of the microbial community across the gradient of antibiotic concentrations

