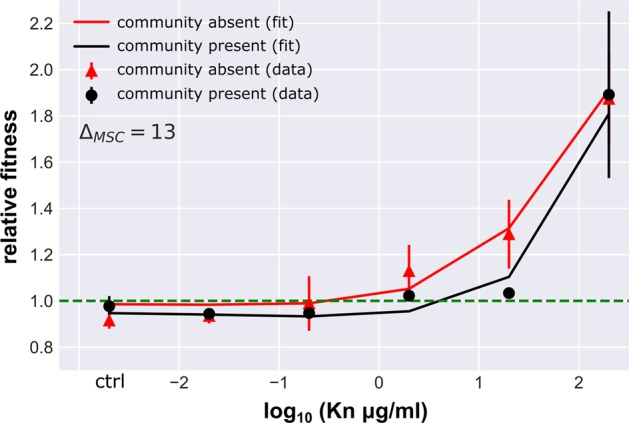
Fig. 4.

Relative fitness of the kanamycin resistant strain. Values (mean ± SD, n = 6) in the presence (black) and absence (red) of the community. Solid lines represent the best fit fitness curve through the mathematical model based on parameter estimates presented in Table 2. The dashed line indicates neutral selection at a relative fitness of ρr = 1, where the intercept with the fitness curve indicates the minimal selective concentration
