Figure 4.

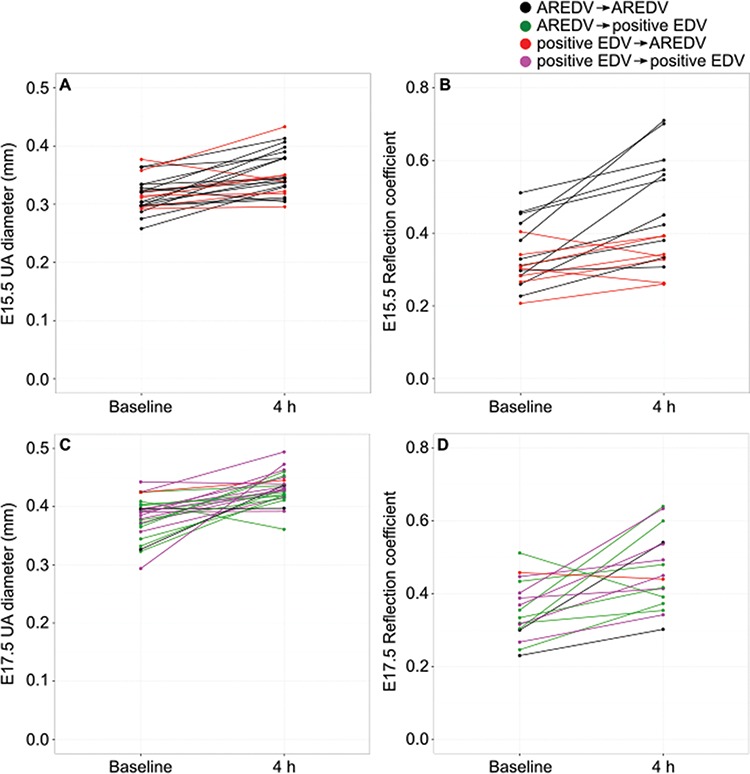
Multiple scatter graphs showing UA diameter and reflection coefficient at baseline and 4 h postinjection of betamethasone for (A and B) E15.5 and (C and D) E17.5. Note the differences based on the changes in UA end-diastolic velocity.

Multiple scatter graphs showing UA diameter and reflection coefficient at baseline and 4 h postinjection of betamethasone for (A and B) E15.5 and (C and D) E17.5. Note the differences based on the changes in UA end-diastolic velocity.