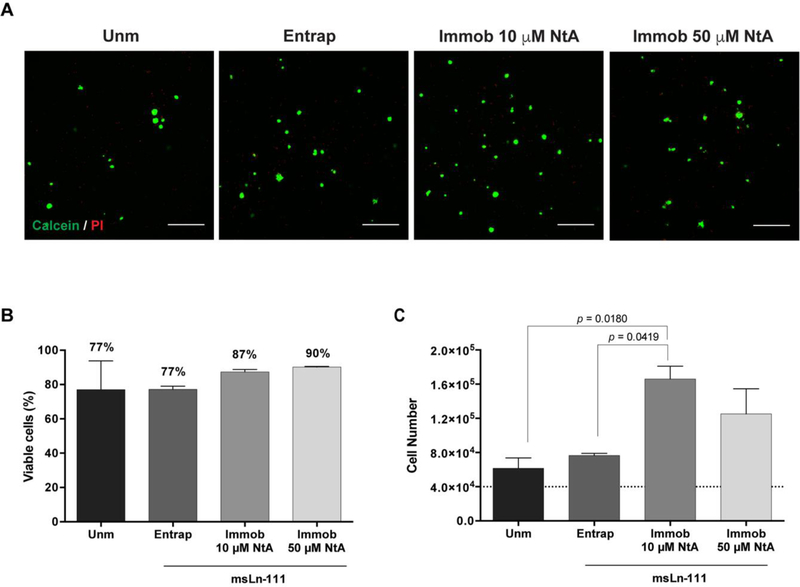
Figure 4. Ability of affinity-bound laminin to support hNSC viability and proliferation.
A) Representative 2D projections of CLSM 3D stack images of cell-laden hydrogels covering a thickness of 300 μm, showing the distribution of live (in green) and dead (in red) cells at day 7 of cell culture. Scale bar = 300 μm. B) Quantitative analysis of live cells at day 7, as determined by flow cytometry. Data represent mean ± SD of three independent experiments. No significant differences were detected (one-way ANOVA followed by Bonferroni’s test). C) Quantitative analysis of total cell number at day 7, as determined by CyQuant® Cell Proliferation kit. The dotted line represents the initial cell density/hydrogel (4 × 10⁴ cells/hydrogel). Data represent mean ± SEM of three independent experiments performed in triplicate; one-way ANOVA followed by Bonferroni’s test.

