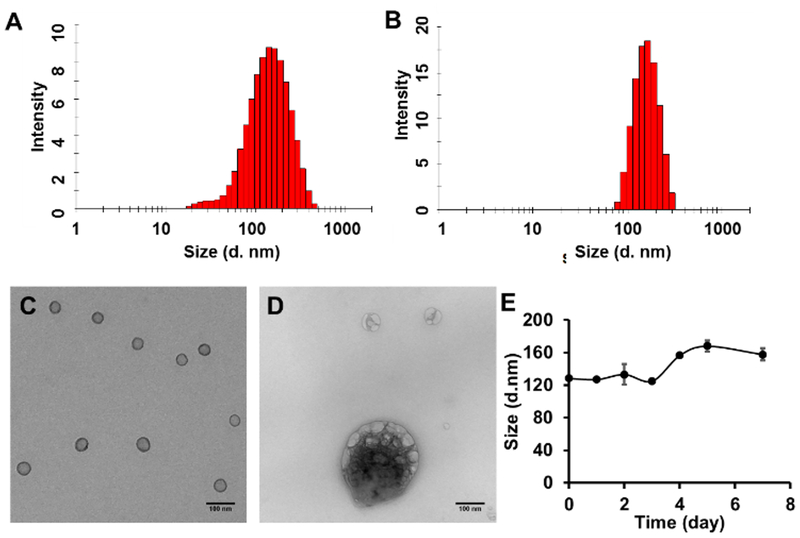
Fig. 1.
Size distribution and TEM images of PhA-NG and PhA-ENG nanogels. Size distribution of PhA-NG (A) and PhA-ENG (B) nanogels measured by Zetasizer based on dynamic light scattering (DLS). Representative TEM images of PhA-NG before (C) and after adding 10 mM GSH (D). Scale bars are 100 nm. (E) Size change of PhA-NG in the in PBS supplemented with 10% FBS.

