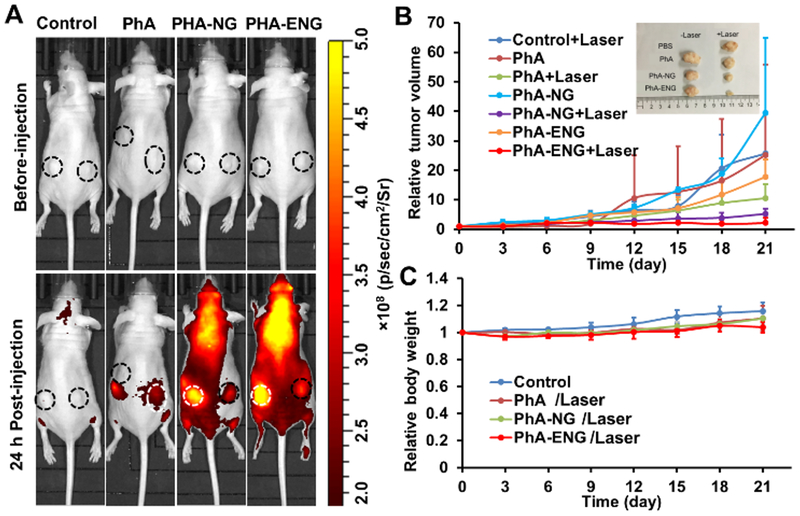
Fig. 6.
(A) Biodistribution of PhA, PhA-NG, and PhA-ENG. UMSCC 22A xenograft mice were administered with PhA, PhA-NG, and PhA-ENG by retro-orbital injection. Mice were imaged 24 h post-injection under IVIS Lumina III In Vivo Imaging System (Ex=620 nm, Em=670 nm). Circle reveals the location of the tumor. White circles indicate a tumor is receiving PDT. The laser power was 11.4 J/cm2. (B) Tumor growth curves after PDT treatment. Inset showed the tumor sizes of different treatments 21 days after PDT. (C) The effect of different treatments on mouse body weight (bars represent ± SD).

