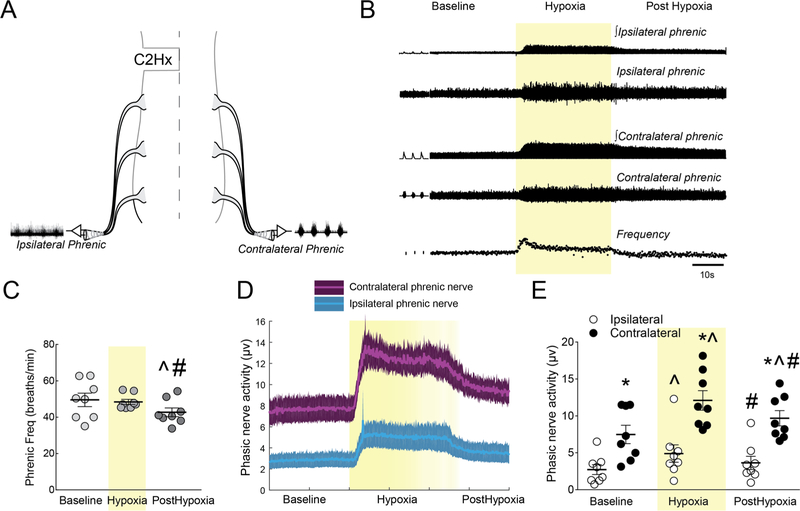
Fig. 2.
A. Schematic illustrating bilateral phrenic nerve recordings following C2Hx. B. Representative compressed raw and integrated phrenic neurograms and instantaneous burst frequency before, during, and after hypoxia. C. Average phrenic burst frequency during the center 50 breaths of each experimental time point. D, E. Ipsilateral and contralateral phrenic traces showing the average (center line) and standard error of the mean (SEM; shaded region) and individual data points for phasic inspiratory nerve activity during baseline, hypoxia (shaded yellow) and post-hypoxia. * Significantly different from ipsilateral; ^ significantly different from baseline; # significantly different from hypoxia. All symbols denote P < 0.05.

