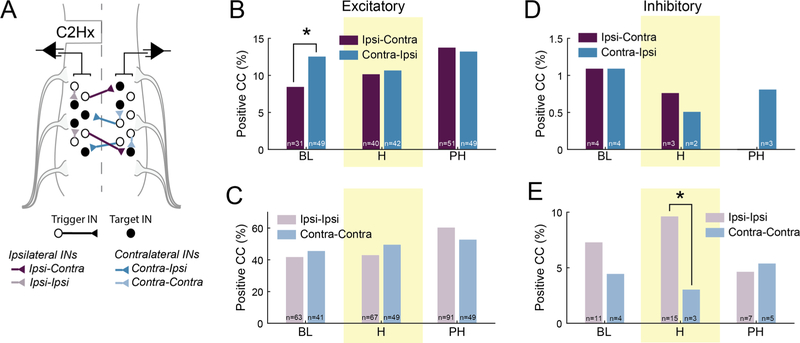
Fig. 4.
A. Schematic illustrating cross-correlation analysis of bilateral multi-electrode array recordings of spinal INs following C2Hx. For each pair of neurons, the trigger cell (open circle) was used to form the correlation histogram, and the target cell (filled circle) fired in synchrony or after the trigger cell. Based on the recording location of the cell soma, a directionality (ex: ipsi to contra) of the connection was assigned. B, C. The proportion of excitatory, and D, E. inhibitory connections (as a % of possible connections) during baseline, hypoxia (shaded yellow) and post-hypoxia across the hemicord (ipsi-contra; contra-ipsi) and within each hemicord (ipsi-ipsi; contra-contra). The number of excitatory/inhibitory connections present at each time is noted in each bar. Note: the total number of possible connections varies within each group at each time point. * Denotes P < 0.05.

