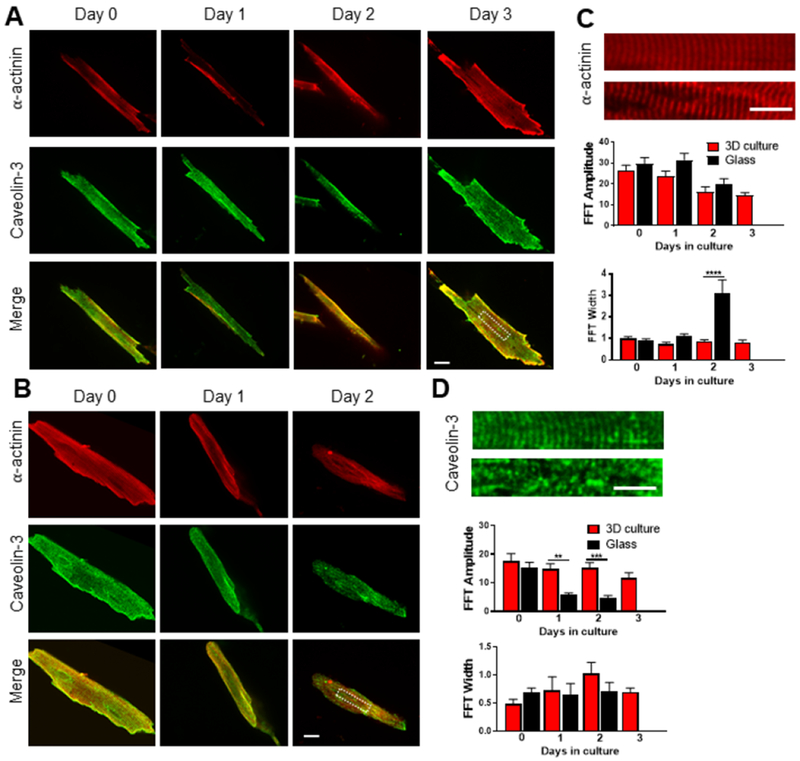
Figure 3: Sarcomeric structure and t-tubules are preserved in adult mouse cardiomyocytes cultured in 3D PEG hydrogels over time.

A) Representative immunofluorescence images of 3D-cultured adult mouse cardiomyocytes stained for α-actinin (red) and caveolin-3 (green) over time. Viability of cells at the moment of fixing was evaluated by calcein staining, which is retained after the staining protocol. Merge image at the bottom of the panel. Scale bar = 20 μm in white. B) Representative images of adult mouse cardiomyocytes cultured on glass coverslips stained for α-actinin (red) and caveolin-3 (green) over time. Merge image at the bottom of the panel. Scale bar = 20 μm in white. C) Above, magnification of the red channel from the white insets reported in panel A and B, respectively. Scale bar = 10 μm in white. Below, column graphs reporting the amplitude and width of the fast Fourier order. n=5 per group. D) Above, magnification of the green channel from the white insets reported in panel A and B, respectively. Scale bar = 10 μm in white. Below, column graphs reporting the amplitude and width of the fast Fourier order. n=5 per group. One-way ANOVA with Bonferroni post-hoc test applied; **p<0.01; ***p<0.0001; ****p < 0.00001. Data reported as mean ± SEM.
