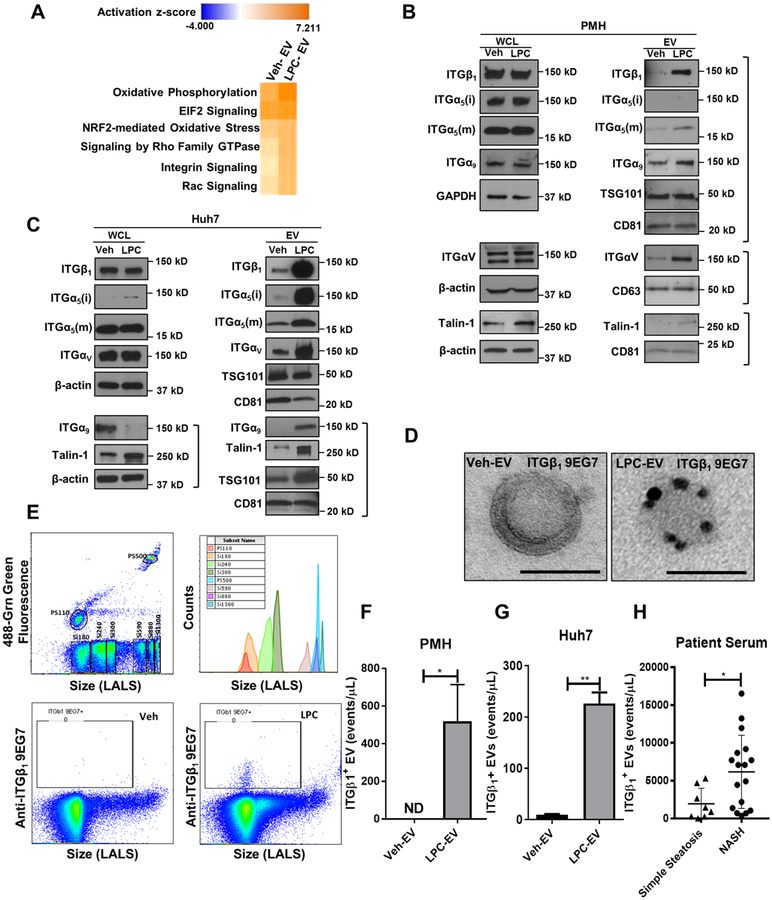
Fig. 1. Lipotoxic hepatocyte-derived EVs are enriched with active ITGβ1.
(A) Top ranked canonical pathways identified by IPA of proteomic data on EVs derived from vehicle or LPC-treated PMH. Immunoblot analysis showing protein levels of integrin family members and Talin-1 on EVs and whole cell lysate (WCL) from (B) PMH or (C) Huh7 cells treated with vehicle or 20 μM LPC for 4 hours. Beta-actin, and the EV markers TSG101, CD63 and CD81 were used as loading controls for WCL and EVs, respectively. (D) Immunogold electron microscopy images showing immunoreactivity for ITGβ1 in an active conformation on EVs derived from PMH treated with vehicle (Veh-EV) or LPC (LPC-EV). Nanoscale flow cytometry showing expression levels of active ITGβ1 on EVs, (E) various sizes silica nanoparticles used as calibration beads to define EVs based on the particle size (top panel). ITGβ1+ EVs from PMH treated with Veh or LPC (bottom panel), quantification of ITGβ1-positive EVs from (F) PMH and (G) Huh7. Bar columns represent mean ± standard error of the mean (SEM); n=3–5. (H) Quantification of ITGβ1+ EVs in the serum of patients with simple steatosis (n=8), and NASH with stage 1–2 fibrosis (n=17). Graphs represent mean ± SEM; *p<0.05, **p<0.01 (Unpaired t test).

