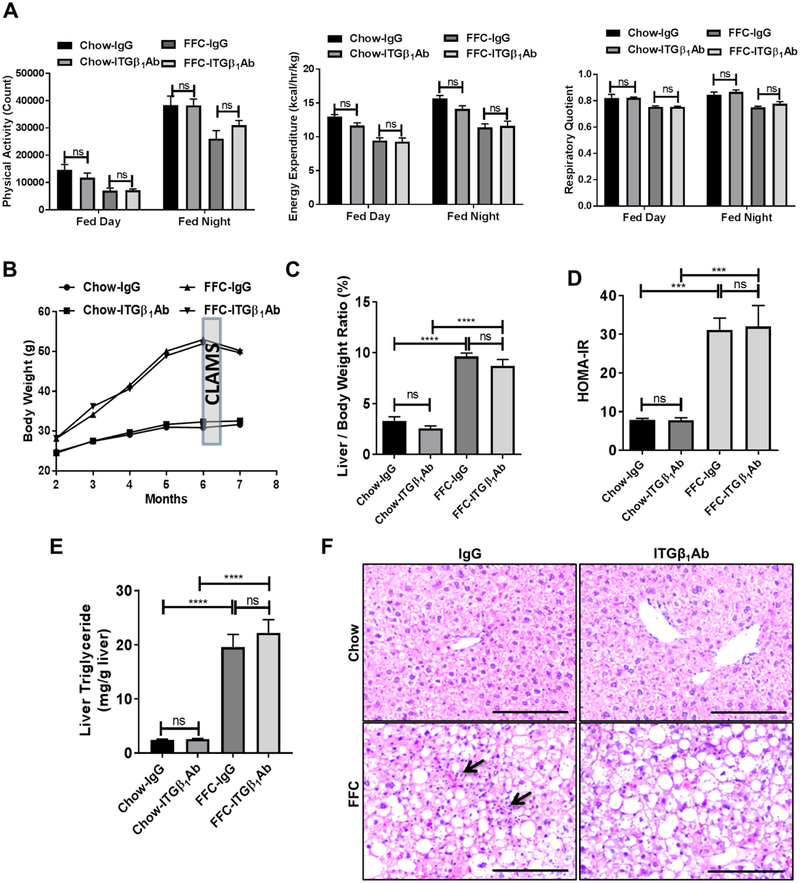
Fig. 4. Anti-ITGβ1 antibody treatment did not alter neither the metabolic phenotype nor the steatosis in FFC diet-fed mice.
Wild-type C57BL/6J mice were fed either chow or FFC diet, and treated with either ITGβ1Ab or control IgG isotype. (A) Physical activity, energy expenditure, and respiratory quotient were assessed by CLAMS chambers. (B) Body weight curves. (C) Liver to body weight ratio at the time of sacrifice. (D) HOMA-IR at 23 weeks. (E) Hepatic triglyceride content. (F) Representative images of H&E staining of liver tissues (scale bar, 100 μm). Arrows indicate inflammatory cells infiltrate; bar graphs represent mean±SEM; ***p<0.001, ****p<0.0001, ns, nonsignificant; n=5–6 per group (One-way ANOVA with Bonferroni’s multiple comparison).

