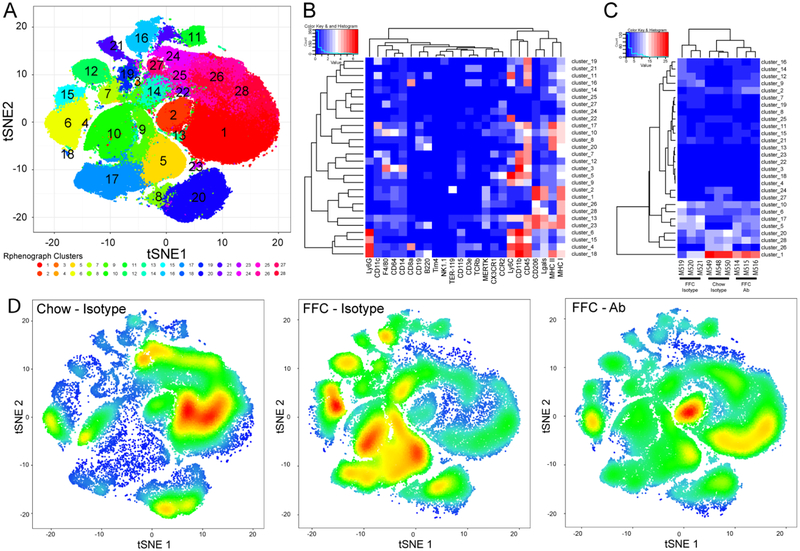
Figure 6. Intrahepatic leukocyte profiling by mass cytometry by time-of-flight (CyTOF).
CyTOF was performed on IHL of chow-fed mice, and FFC-fed mice treated with either ITGβ1Ab or control IgG isotype. IHL from IgG-treated chow-fed mice were used as control. (A) Twenty-eight unique clusters of IHL were defined by a 24 cell surface marker panel using the Rphenograph clustering algorhithm and were visualized on a t-distributed stochastic neighbor embedding (tSNE) plot. (B) Heat map demonstrating the distribution and relative intensity of the cell surface markers used in the clustering analysis. (C) Heat map showing the relative abundance of each cluster for each mouse. (D) Representative tSNE plots of each group. Red indicates high frequency categorization of cells to a cluster; blue indicates low frequency; n=3 per group.

