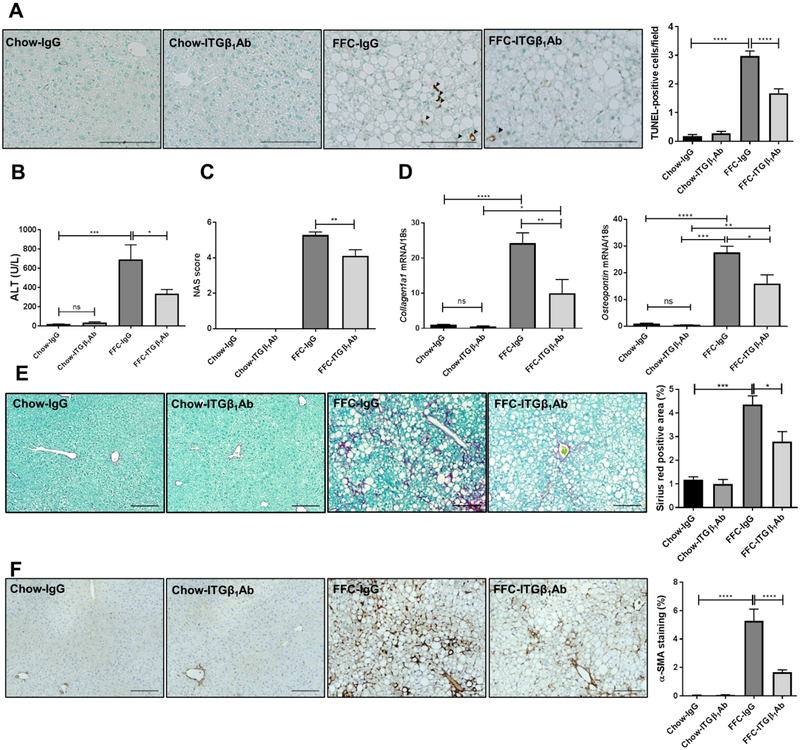
Fig. 8. Anti-ITGβ1 antibody treatment reduces FFC diet-induced liver injury and fibrosis in murine NASH.
(A) Representative images of TUNEL staining of liver sections, quantification of TUNEL-positive cells. (B) Serum ALT levels. (C) NAS scores. (D) Hepatic mRNA expression of Collagen1a1 and Osteopontin. (E) Representative images of Sirius red staining, quantification of Sirius red-positive areas. (F) Representative images of α-SMA staining of liver sections, quantification of α-SMA-positive areas. Scale bars: 100 μm; n=5–6 per group; bar graphs represent mean±SEM; *p< 0.05, **p<0.01, ***p<0.001, ****p<0.0001(One-way ANOVA with Bonferroni’s multiple comparison).

