
FIGURE 4.
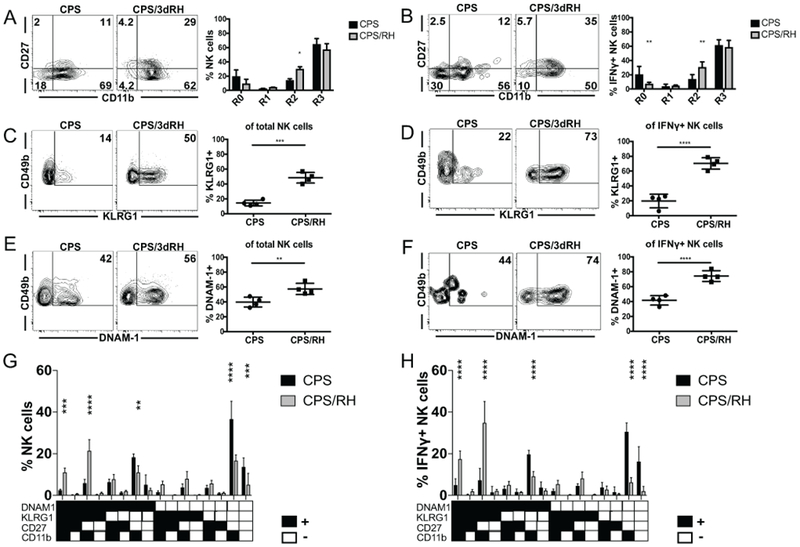
Activated NK cells during secondary T. gondii infection are mature. (A-H) B6 mice were infected i.p. with 1 × 10⁶ CPS and 5–6 wk later were infected i.p. with 1 × 10³ RH tachyzoites. PECs were analyzed by flow cytometry at d 3 after RH infection. (A and B) The frequency of R0 (CD27–CD11b–), R1 (CD27+CD11b−), R2 (CD27+CD11b+), R3 (CD27−CD11b+) NK cells within the (A) total and (B) IFNγ+ NK cells. (C and D) The frequency of KLRG1+ NK cells within (C) total and (D) IFNγ+ NK cells. (E and F) The frequency of DNAM-1+ NK cells within the (E) total and (F) IFNγ+ NK cells. (G and H) The frequency of NK cells expressing the combinations of the receptors (KLRG1, DNAM1, CD27, CD11b) within the (G) total and (H) IFNγ+ NK cells. The graphs present data from 1 of 2 independently repeated experiments with an n = 4 mice/group. Data are the mean ± SD. *p < 0.05, **p < 0.01, ***p < 0.001, ****p < 0.0001, one-way and two-way ANOVA.