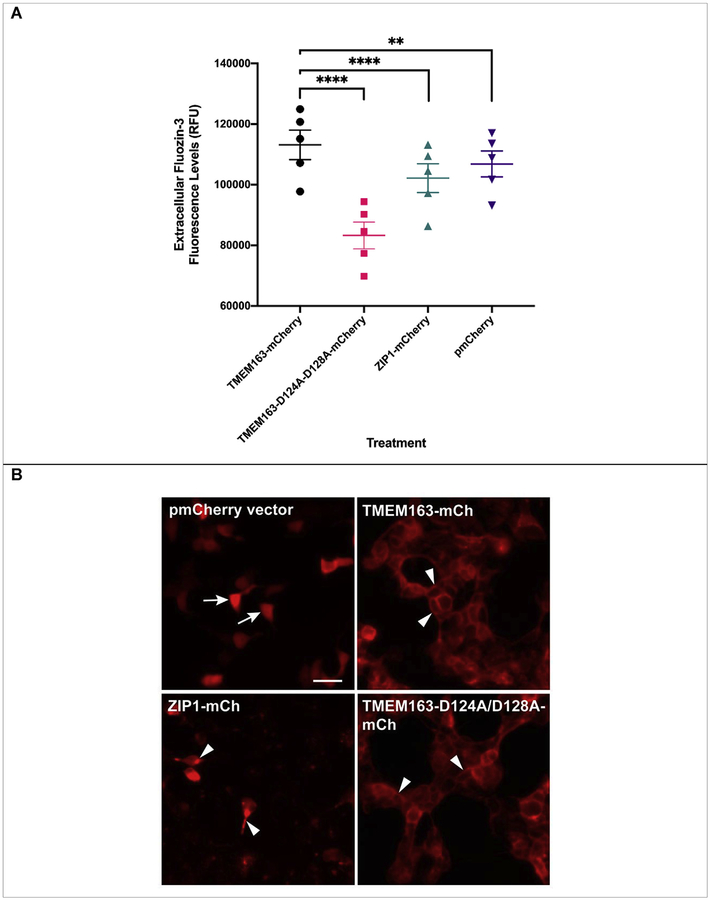
Fig. 3. Spectrofluorometric assay and fluorescence microscopy of HEK-293 cells transiently expressing wild-type TMEM163, TMEM163-D124A/128A, ZIP1, and pmCherry empty vector control.
A) Cell membrane impermeant Fluozin-3 fluorescence analysis reveals a significant increase in extracellular fluorescence upon expression of TMEM163 protein when compared with controls. Data are represented as mean ± SEM of each kinetic time point analyzed (**p=0.002, ****p < 0.0001; Tukey’s multiple comparisons post-hoc test; n ≥ 5 independent trials). B) Representative fluorescent micrographs showing subcellular distribution of pmCherry (mCh) empty vector, TMEM163-mCherry, ZIP1-mCherry, and TMEM163-D124A/D128A-mCherry. TMEM163 and TMEM163-D124A/D128A localize within the plasma membrane and membrane compartments (arrowhead). ZIP1 is also detected within the plasma membrane and intracellular membrane compartment (arrowhead). The pmCherry vector exclusively localizes in the cytoplasm (arrow). Scale bar: 50 μm.

