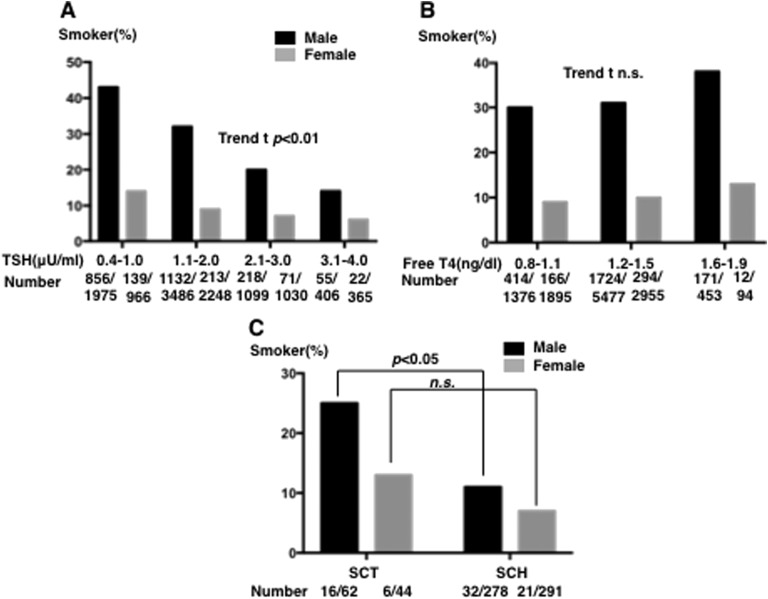
Figure 4.
Effects of smoking on serum TSH and free T4 levels in subjects with euthyroxinemia. (A) Graph shows the percentage of smokers in each quartile of serum TSH groups within the normal TSH range (among men: 856 of 1975 in the group with serum TSH levels between 0.4 and 1.0 mU/L, 856 of 3488 with levels between 1.1 and 2.0 mU/L, 1132 of 1099 with levels between 2.1 and 3.0 mU/L, and 55 of 406 with levels between 3.1 and 4.0 mU/L; in women, the percentages were 139 of 966, 213 of 2249, 71 of 1030, and 22 of 365, respectively; t-trend: P < 0.01 and P < 0.01). (B) Graph shows the percentage of smokers in each quartile of serum free T4 groups within the normal free T4 range (in men: 414 of 1376 in the group with serum free T4 levels between 0.8 and 1.1 ng/dL, 1727 of 5477 between 1.2 and 1.5 ng/dL, and 171 of 453 between 1.6 and 1.9 ng/dL; in women, the percentages were 166 of 1896, 294 of 2955, and 12 of 94, respectively; t-trend: n.s. and n.s., respectively). (C) Graph comparing the prevalence of smokers among men with SCT and those with SCH (16 of 62 and 32 of 278, respectively) and among women with SCT and SCH (6 of 44 and 21 of 291, respectively). n.s., not significant.

