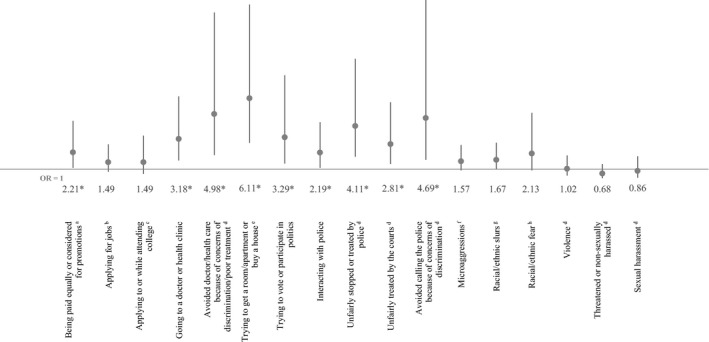
Figure 1.

Adjusted odds of experiencing discrimination among Latinos compared to whites (reference group). OR, Odds Ratio, with 95% Confidence Interval bars. Nationally representative sample of Latino and non‐Hispanic White adults ages 18+. *Indicates statistical significance at P < .05. Don't know/refused responses coded as missing. Odds ratios report the odds that Latinos reported experiencing discrimination for each outcome (Whites were the reference group). These estimates control for gender, age (18‐29, 30‐49, 50‐64, 65+), education (<college vs college graduate or more), household income (<$25 k, $25 k‐<$50 k, $50 k‐<$75 k, $75 k+), living in a neighborhood that is predominantly one's own race/ethnicity, household location (urban, suburban, rural), region (Northeast, Midwest, South, West), and for health care outcomes only, health insurance status (uninsured, Medicaid insured, non‐Medicaid insured). aEqual pay question only asked among respondents who have ever been employed for pay. bJobs question only asked among respondents who have ever applied for a job. cCollege application/attendance was only asked among respondents who have ever applied for college or attended college for any amount of time. dIncludes discrimination against you or a family member because you are Latino/White. eHousing question only asked among respondents who have ever tried to rent a room or apartment, or to apply for a mortgage or buy a home. fMicroaggressions indicate that someone made negative assumptions or insensitive or offensive comments about you because you are Latino/White. gRacial/ethnic slurs indicate that someone referred to you or your racial group using a slur or other negative word because you are Latino/White. hRacial/ethnic fear indicates that people acted as if they were afraid of you because you are Latino/White
