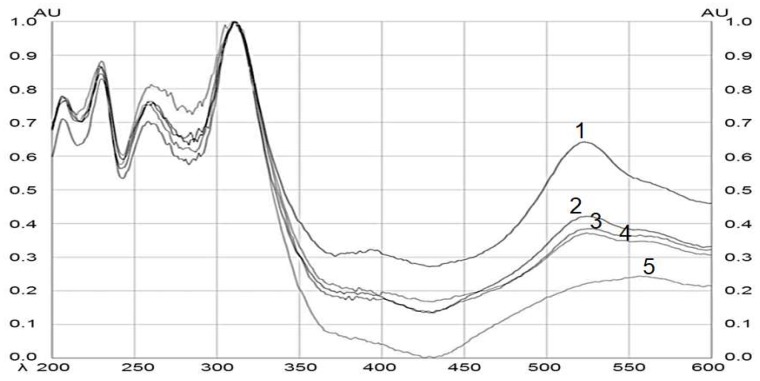
Figure 4.
Spectral comparison of HPTLC chromatograms obtained by the BSSG standard, and ethanolic extracts obtained by MAE and by maceration of A. angustifolia. Wavelengths from 200 to 600 nm. (1) BSSG standard, (2) ethanolic extracts by MAE in extraction time of 5 s with KOH solution, (3) ethanolic extracts by MAE in extraction time of 10 s with KOH solution, (4) ethanolic extracts by MAE in extraction time of 15 s with KOH solution, and (5) ethanolic extracts by maceration at 48 h.

