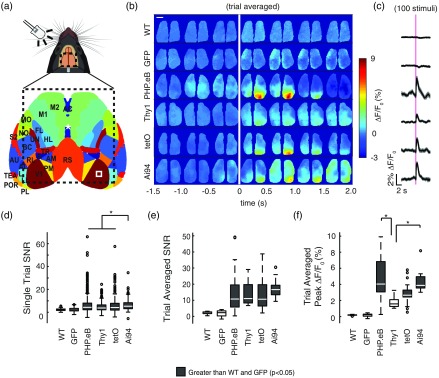
Fig. 3.
Visually evoked responses. (a) Top: representation of LED flash stimulus experiments. A LED, facing toward the left eye of the mouse flashed once every 10 s. Bottom: cortical atlas from Allen Institute outlining cortical regions observed in transcranial imaging setup (outlined by dotted line). Bregma is shown by white asterisk. Evoked responses are observed in contralateral monocular V1 (white box). (b) Representative averaged responses over a 5-min trial. Individual cortical images represent the averaged over 0.5-s increments. A 5-ms LED flash occurs at 0 s (vertical white line) (). (c) Responses from contralateral V1 [white box from (a)]. LED flash indicated by magenta line. (d) SNR measurements for single LED flashes (see Sec. 2). (e) SNR measurements and (f) peak for trial-averaged LED flashes (*; Kruskal–Wallis with post hoc Bonferroni correction).

