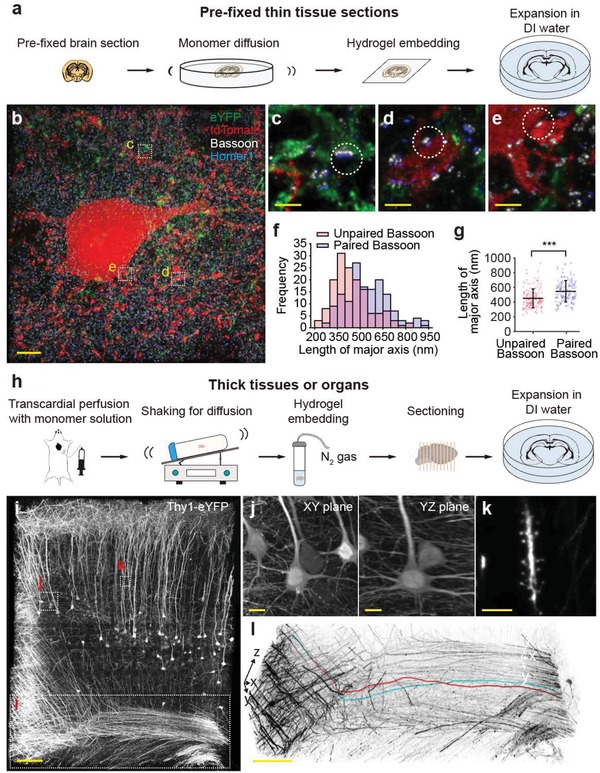
Figure 4.

ZOOMing into neural structures in mouse brain tissues. a) ZOOM process for pre‐fixed thin tissue sections. b–g) PV‐tdTomato reporter mice (obtained by breeding PV‐Cre mice with Ai14 reporter line) were injected with adeno‐associated virus carrying eYFP under the CaMKIIα promoter to label parvalbumin‐expressing interneurons with tdTomato (red), and pyramidal neurons with eYFP (green). A formaldehyde‐fixed 100 µm‐thick coronal section from the primary sensory cortex was then subject to ZOOM, with Bassoon (white) and Homer1 (blue) staining (4.0× expansion). b) 3D rendering of cortical tissue area. Bassoon is a pre‐synaptic marker for both excitatory and inhibitory synapses, whereas Homer1 is a post‐synaptic marker for only excitatory synapses. Therefore, an adjacent pair of Bassoon and Homer1 indicates the presence of an excitatory synapse, while unpaired Bassoon may indicate the inhibitory synapse. Consistently, excitatory synapses were found at the c) pyramidal axons and d) dendrites of PV+ neurons, while inhibitory synapses were found at the e) synapses between the PV neurons. f) Histogram of major axis lengths of Bassoon paired or unpaired with Homer1 (n = 150 for each). g) The major axis length of the unpaired Bassoon is significantly shorter than that of the paired Bassoon (p = 5.76 × 10⁻⁹, Mann–Whitney U test). h) ZOOM process for thick samples, for which transcardial perfusion is applicable evenly distributed monomer solutions. i–l) A 500 µm‐thick Thy1‐eYFP mouse brain section was ZOOM‐processed and imaged with light‐sheet microscopy. The whole brain was gel‐embedded after delivering monomers by transcardial perfusion. 5.22 × 1010 µm3 of ZOOM‐processed mouse cortical tissue (2.42 × 108 µm3 before expansion) was imaged with a low‐power objective lens (6.0× expansion). If the unexpanded sample were imaged with a high‐power objective lens to achieve a comparable resolution (e.g., 20×, 1.0 NA objective lens), estimated acquisition time would be 30‐fold longer. i) 3D rendering of the volume image. Despite the poor lens performance, j) the morphology of cell bodies as well as k) dendritic spines is clearly observed at the improved resolution. l) Individual axon fibers could also be readily traced (red and cyan traces). Data are mean ± s.d. Scale bars, b) 5 µm, c–e) 1 µm, i) 100 µm, j) 10 µm, k) 5 µm, l) 100 µm.
