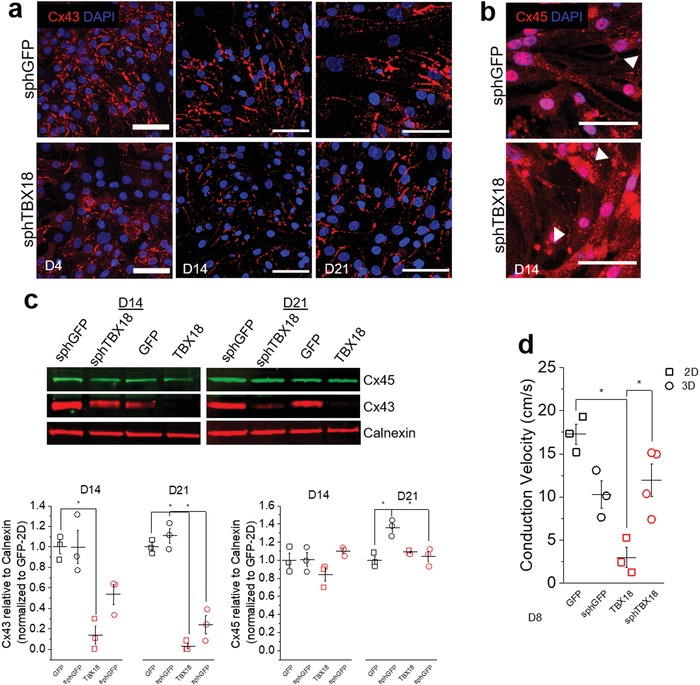
Figure 3.

Gap junction protein expression and conduction velocity measurements. a) Representative immunostaining of Cx43 in spheroids on day 4, 14, and 21, scale bar 50 µm. b) Representative immunostaining of Cx45 in spheroids on day 14, scale bar 50 µm. c) Representative western blot of Cx43 and Cx45 for 2D and 3D groups on day 14 and 21 (10 ug protein per lane) with Calnexin as the loading control. Quantification of Cx43 and Cx45 protein, one‐way ANOVA from separate days, *p < 0.05 (mean ± SE, n = 3). d) Conduction velocity (cm s−1) from 2D or 3D cultures on day 8 (6‐well plate, 64 electrodes), one‐way ANOVA, *p < 0.05, n = 3–4 (*based on wells with synchronous beats) (mean ± SE).
