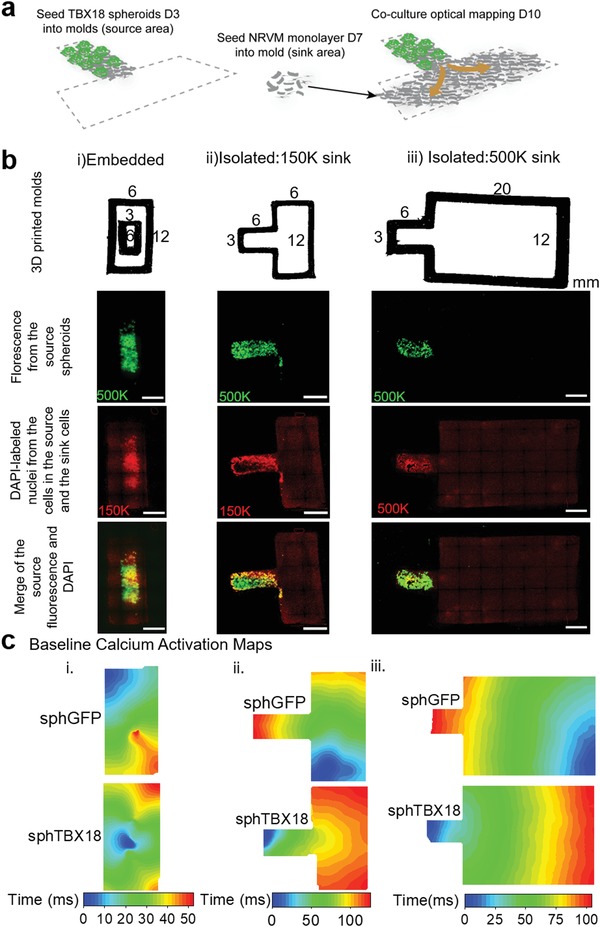
Figure 5.

Generation of eSAN cocultures to monitor propagations of pace‐and‐drive with optical mapping. a) Schematic of cocultures achieved by patterning spheroids, depicted by green reporter, in desired location and naïve NRVM separately. b) Top row: 3D printed molds with dimensions for three designs. Second row: tile‐scan of the green fluorescence from the ZsGreen reporter in TBX18‐spheroids to indicate the source location. Third row: tile‐scan DAPI represents naïve untransduced NRVM nuclei and source nuclei (pseudocolor red). Fourth row: tile‐scan composite of green and DAPI. Scale bars 3 mm. c) Baseline calcium activation map of typical conduction propagations.
