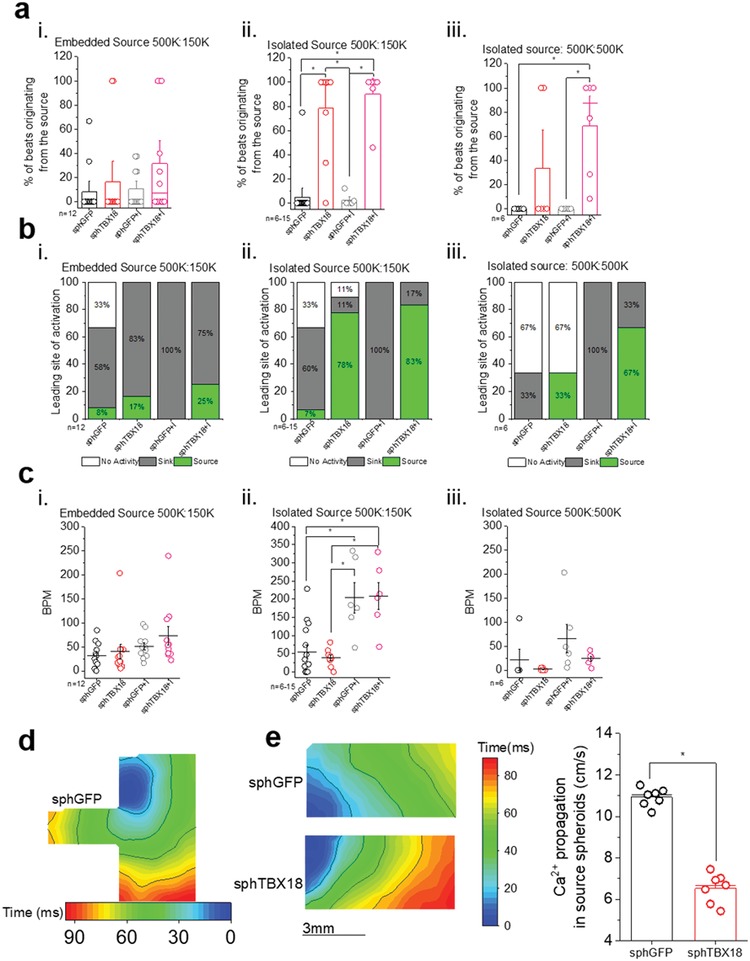
Figure 6.

Quantification of eSAN coculture ability to pace‐and‐drive with optical mapping. a) Quantification of percent of beats originating from the source (spheres): Percent of beats originating from the source = 100% × (number of beats from source/total beats), one‐way ANOVA, *p < 0.05, mean ± SE. b) Classification of leading site of activation. If the percent of beats originating from the source was ≥50 than it is classified as “source,” <50 is “sink” and “no activity” was reserved for quiet cocultures. c) Quantification of beating rate (BPM), one‐way ANOVA, *p < 0.05, mean ± SE. d) Examples of re‐entrant arrhythmias such as self‐sustaining, fast rotors. e) Representative calcium activation map of source area (only spheroids) and quantification of Ca2+ propagation velocity (cm s−1) through source spheroids (Ca2+ propagation, cm s−1), n = 7, one‐way ANOVA, *p < 0.05, mean ± SE.
