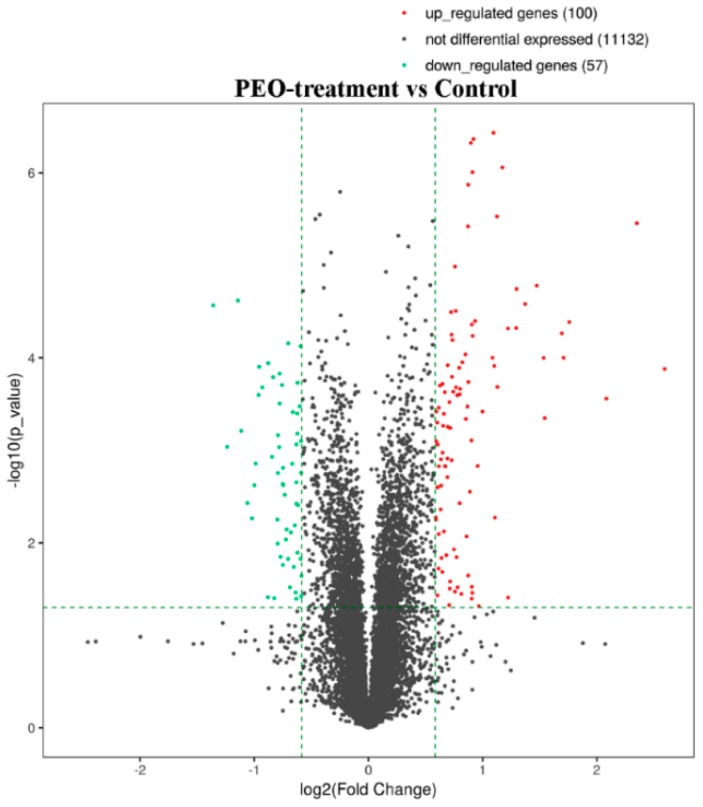
Figure 7.
The volcano plot of mRNA. The vertical two green lines were up-regulated (right side) and down-regulated (left side), respectively. The green parallel lines corresponded to the p-value threshold. Green dots represent down-regulated genes with significant differences, red dots represent up-regulated genes with significant differences, and gray dots represent non-significant different genes.

