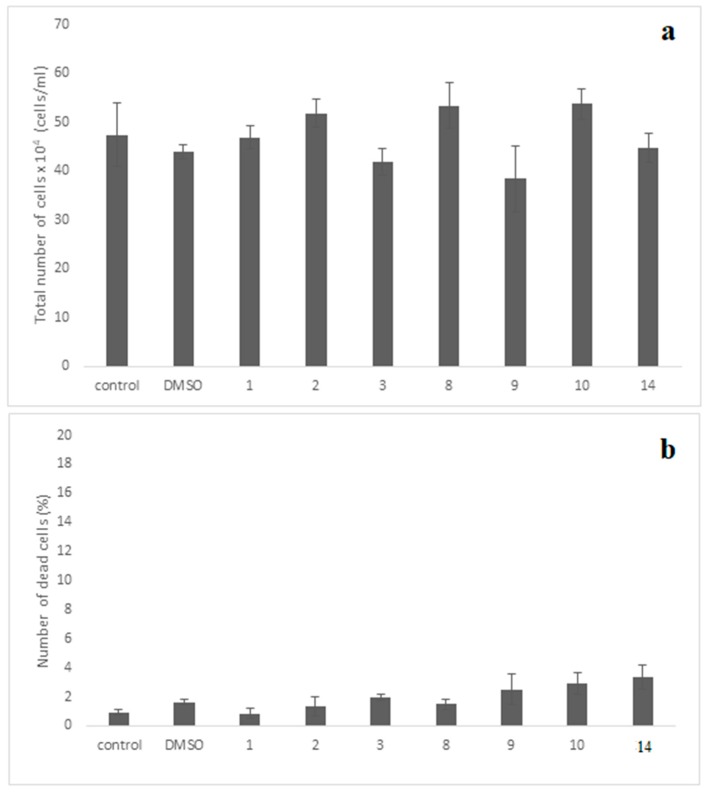
Figure 10.
Assessment cell growth (a) and cell death (b) of MRC-5 cells exposed to various compounds. The MRC-5 cell cultures were incubated separately with each of the compounds at 10−5 M (10μΜ) for 48 h. The cell growth was determined by measuring the cell number in cultures under the microscope using the Neubauer counting chamber, as described in the “Materials and Methods”. Moreover, the dead cells accumulated in these cultures were also evaluated using the Trypan-blue exclusion-dye method, as presented in “Materials and Methods”. The results shown above indicate the mean numbers ± SD of two independent biological experiments. The diagrams shown above and the t-test statistical analysis were carried out using the GraphPad Prism 6.0 program. Notably, no statistical significance between the control-untreated culture with each one of compounds-treated cultures is seen (p values > 0.05).

