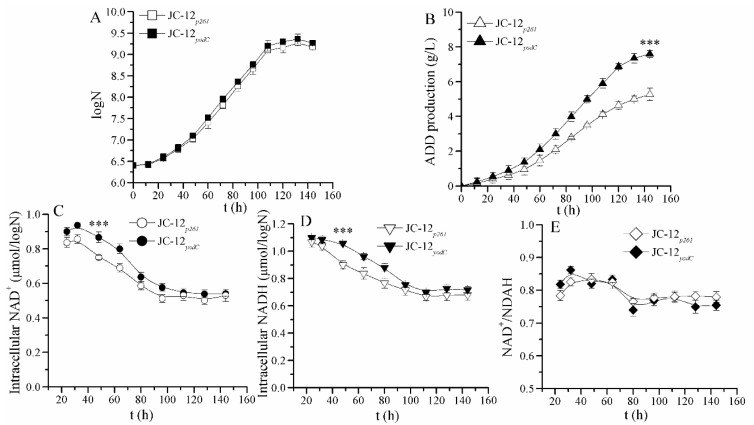
Figure 2.
Time profiles of ADD fermentation and intracellular NADH and NAD+ concentrations by strain JC-12p261 (hollow) and strain JC-12yodC (solid). (A) the cell growth; (B) the ADD production, (C) intracellular NAD+ concentration; (D) intracellular NADH concentration; (E) intracellular NAD+/NADH ratio. N, the number of CFU (colony forming units) per mL of culture broth. An amount of 20 g/L phytosterol was used as a substrate to carry out the fermentation. The results are shown in biological triplicate. One-way ANOVA was used to examine the mean differences between the points of the data groups. *** p < 0.001. The statistical significance has been found between the two analyzed strains. Error bars show standard deviations.

