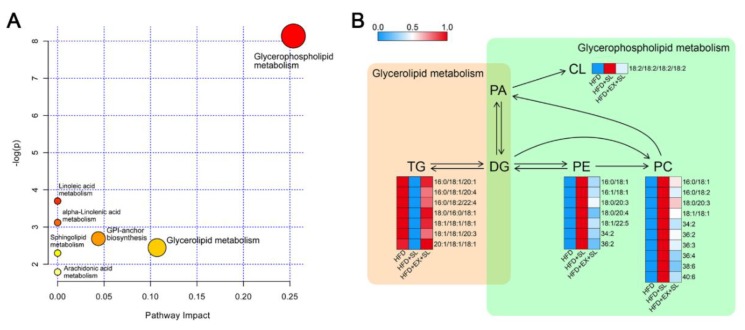
Figure 7.
Lipid metabolic pathway analysis of differential lipid species. (A) Bubble chart of the pathway analysis by MetaboAnalyst. (B) Summary of the main relationships among differential lipid species related to glycerophospholipid and glycerolipid metabolism. Red denotes a relative increase, and blue denotes a relative decrease.

