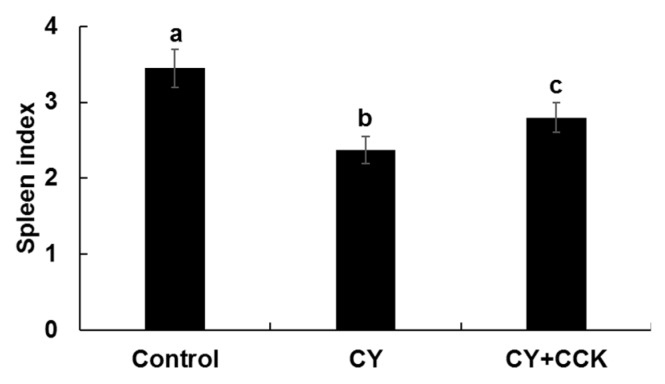
Figure 3.
Spleen indices of CY-treated BALB/c mice with or without CCK-oligosaccharides. Control group (n = 6), no CY induction or CCK-oligosaccharides administration; CY group (n = 6), CY induction (80 mg/kg) on days 1–3 and saline administration on days 4–10; CY + CCK group (n = 6), CY induction (80 mg/kg) on days 1–3 and CCK-oligosaccharides administration (200 mg/kg) on days 4–10. One-way ANOVA was used for comparison of group mean values, followed by Duncan’s multiple range test for significance of individual comparisons (p < 0.05). Different alphabet letters among groups represent statistically significant difference.

