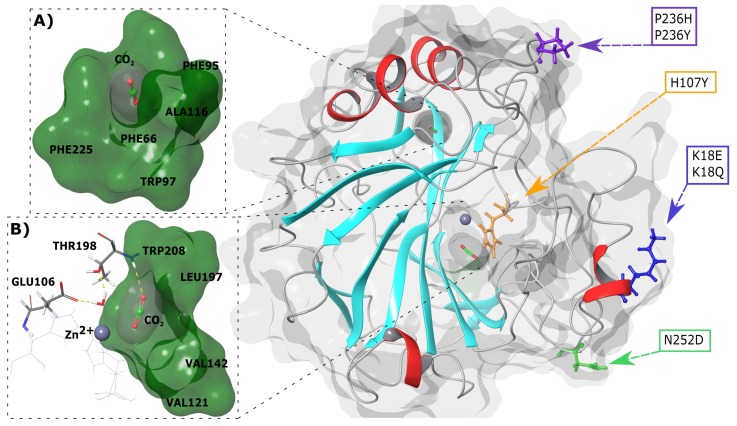
Figure 1.
3D structure of human CA-II WT protein and SNV locations. (A) Secondary CO binding pocket. (B) Primary CO binding pocket. Cyan and red secondary structure represents beta sheets and helices, respectively. The grey sphere represents the Zn. Representations were generated using Schrödinger Maestro and Inkscape.

