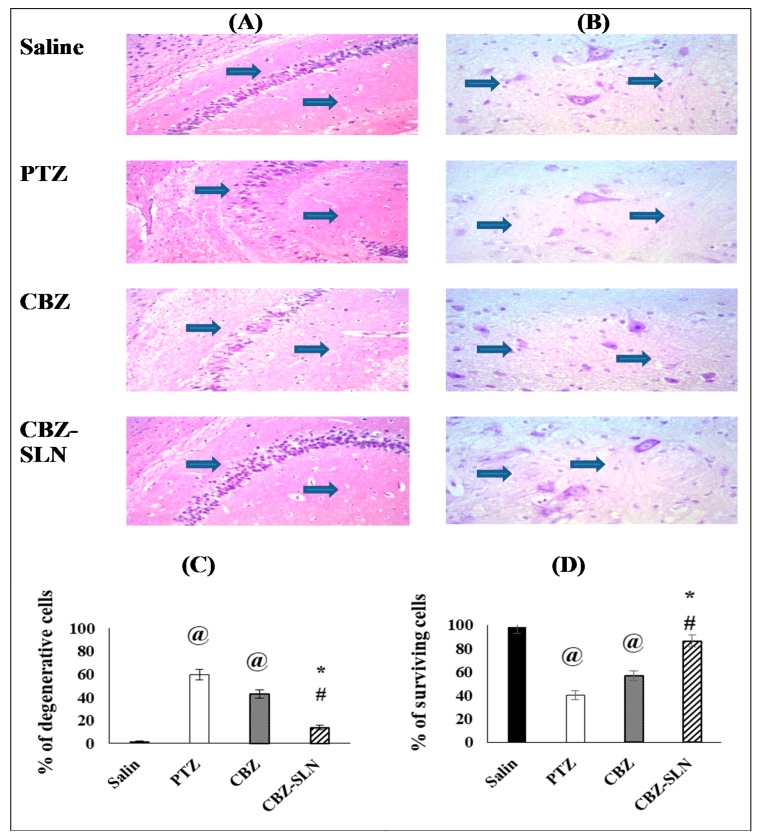
Figure 8.
The effect of all pharmacological treatments in the photographic pictures of the hippocampus sections. (A) Histopathological pictures stained with hematoxylin plus eosin, (B) photographic pictures of hippocampus sections stained with Cresyl violet, (C) the percentage of degenerative cells in the hippocampal area of the different groups, and (D) the percentage of surviving cells in the hippocampal area of the different groups. Data are presented as mean ± SEM and were analyzed using a one-way ANOVA followed by Bonferroni’s post-hoc test at p < 0.05. @ compared to the saline group, * Compared to the PTZ group, # compared to the CBZ group.

