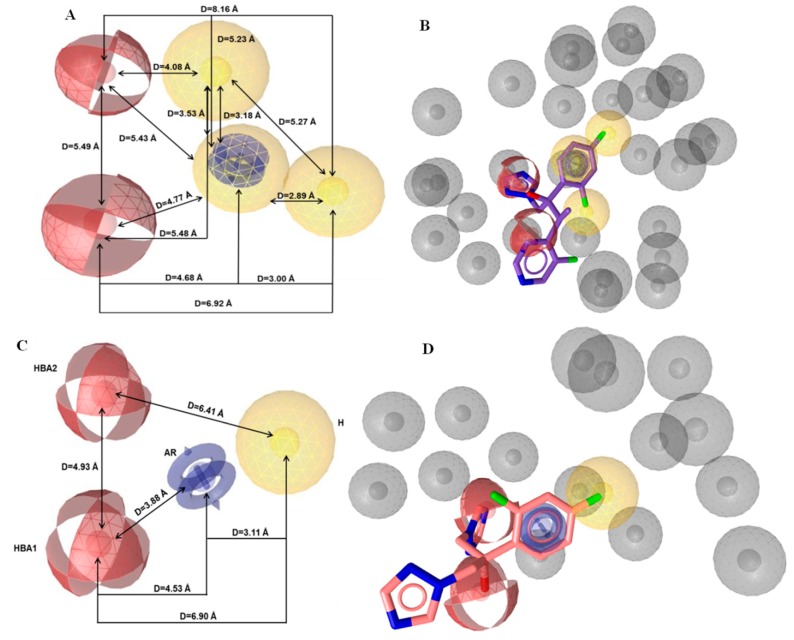
Figure 4.
Representation of (A) the initial and (C) the optimum pharmacophore model features. Fitted of (B) voriconazole on the initial pharmacophore features and (D) fluconazole on the optimum pharmacophore features. The depiction of the features is colored as follows: hydrogen bond acceptors (HBA) as red spheres, hydrophobic regions (H) as yellow spheres, aromatic rings (AR) as blue rings, and exclusion volumes (Ex. Vol.) as grey spheres. The distances (Å) between the chemical features are illustrated as black lines.

