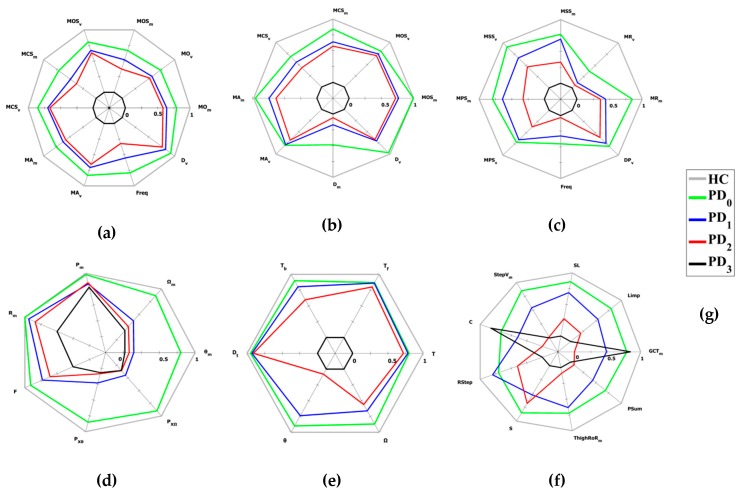
Figure 4.
Radar charts of the kinematic parameters for upper and lower limb tasks. Mean values of the most significant kinematic parameters for healthy control (HC) and Parkinson’s disease (PD) subjects, grouped by severity classes according to the “video” scores assigned by N1, decrease monotonically with the increase of the impairment severity (Table S1 in Supplementary Materials for the parameter list and their meaning). (a) Finger tapping; (b) closing–opening; (c) pronation–supination; (d) leg agility; (e) sit to stand; (f) gait and (g) legend for HC and PD severity classes (HC refers to healthy controls; PD0 refers to UPDRS 0 severity class; PD1 refers to UPDRS 1 severity class; PD2 refers to UPDRS 2 severity class; PD3 refers to UPDRS 3 severity class).

