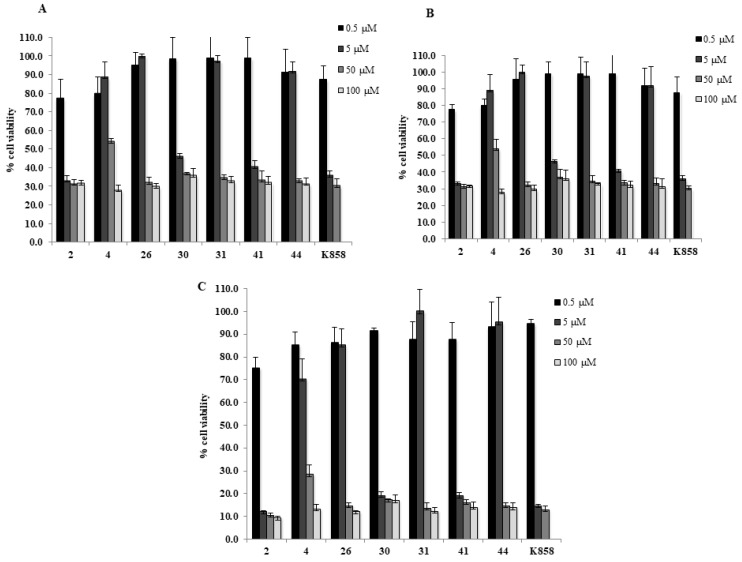
Figure 2.
MTT cell viability assay on AGS. Histograms represent the viability dose-response of AGS cells exposed to different concentrations of compounds 2, 4, 26, 30, 31, 41, 44, and K858 (from 0.5 to 100 μM) for 24, 48, and 72 h (A–C, respectively). Metabolic activity was assessed using MTT assay and normalized to control cells treated with DMSO (0.2% as final concentration).

