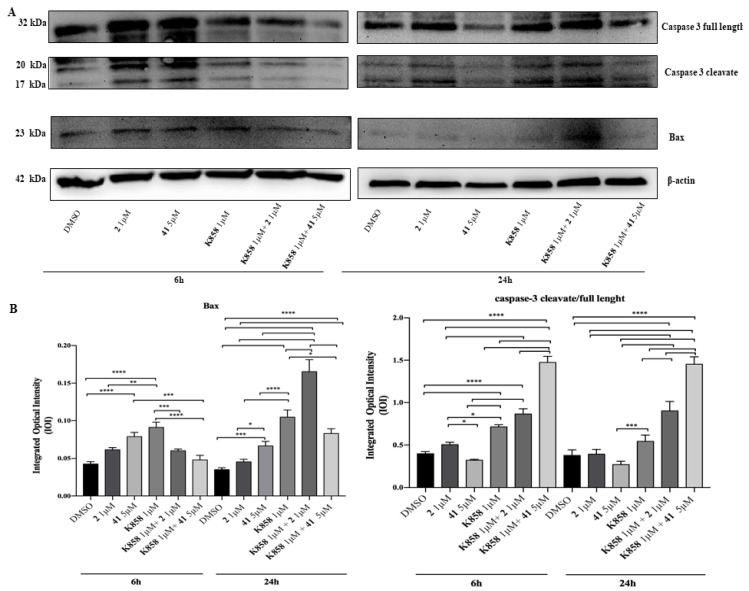
Figure 6.
Western blotting analysis of Bax and Caspase-3 expression in AGS cell line treated with compounds 2, 41, K858 as single agents and in co-treatment. (A) Cells treated with DMSO (0.2%) were loaded as negative control. Each membrane was probed with β-actin antibody to verify loading consistency. Western blot is the most representative of three different experiments. (B) Histograms represent densitometric measurements of proteins bands expressed as integrated optical intensity (IOI) mean of three separate experiments. The error bars show standard deviation (± SD). Densitometric values analyzed by ANOVA (post hoc application of Tukey’s multiple comparison test) return significant differences. **** p < 0.0001, *** p < 0.0002, ** p < 0.0005, * p < 0.005.

