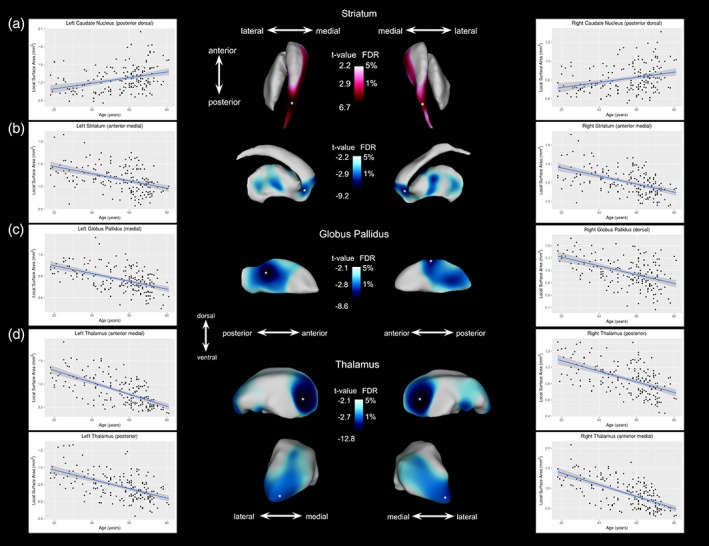
Figure 2.

Age‐related areal contraction and expansion in shape (surface area) observed at the 1% FDR threshold. Red color maps indicate local surface area expansion with age after 1–5% FDR correction; blue color maps on the subcortical surfaces indicate local surface area contraction with age after 1–5% FDR correction. Each plot displays the age versus surface area measurements for peak vertex (denoted by a white asterisk). (a) Age‐related expansion in surface area of the bilateral medial and dorsal posterior caudate nucleus. (b) Age‐related contraction in surface area of the bilateral anterior and medial anterior striatum, particularly the anterior caudate nucleus and nucleus accumbens. (c) Age‐related contraction was observed in the medial posterior end of the left and right globus pallidus. (d) Age‐related contraction in surface area of the bilateral thalami, particularly in the anterior medial region and in the pulvinar nucleus (located at the posterior end of the thalamus) [Color figure can be viewed at http://wileyonlinelibrary.com]
