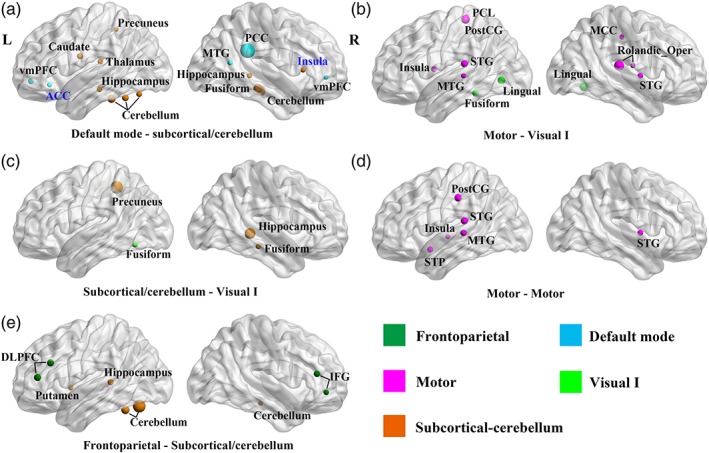
Figure 3.

Group differences on node semi‐metric percentage (SMP). Figures are arranged in a descending order according to the effect size of group comparison at the network level, (a) being the largest. The size of the node is proportional to the F‐value of the main effect of diagnosis. Only nodes with p < .05 are presented. The colors of the nodes represent different networks according to the key. Black node names denote increased SMP in autism, while blue node names denote decreased SMP in autism. ACC, anterior cingulate cortex; DLPFC, dorsal lateral prefrontal cortex; IFG, inferior frontal gyrus; MCC, middle cingulate cortex; MTG, middle temporal gyrus; rolandic_Oper, rolandic operculum; PCC, posterior cingulate cortex; PCL, paracentral lobule; PostCG, postcentral gyrus; STG, superior temporal gyrus; STP, superior temporal pole; vmPFC, ventral medial prefrontal cortex [Color figure can be viewed at http://wileyonlinelibrary.com]
