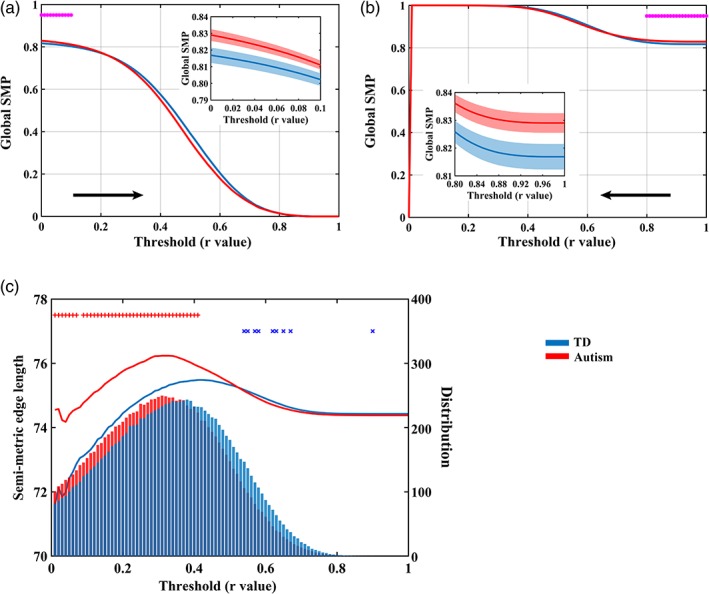
Figure 5.

Strength and length of semi‐metric edges. Main effect of diagnosis on global semi‐metric percentages (SMP) when removing (a) low strength edges and (b) high strength edges. The "*" symbol denotes significant group differences (p < .05). Detailed information on significant group differences are plotted in the mini‐panel. Shaded regions represent standard errors. (c) Average semi‐metric edge length and the distribution of semi‐metric edges. Line plots denote the relationship between correlation coefficients and semi‐metric edge lengths, and the histogram denotes the average number of semi‐metric edges within each group. The + denotes significant main effects of diagnosis on semi‐metric edge length (p < .05; red: autism > TD; blue: autism < TD); the "×" symbol denotes significant main effects of diagnosis on the number of semi‐metric edges (p < .05; red: autism > TD; blue: autism < TD) [Color figure can be viewed at http://wileyonlinelibrary.com]
