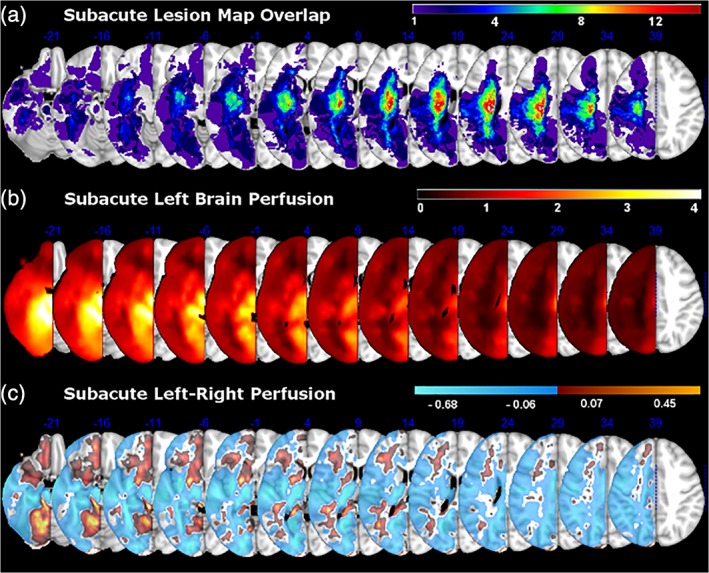
Figure 4.

(a) The distribution of brain coverage by lesions within our patient sample. (b) Group‐averaged left‐brain perfusion. (c) Differences in left‐brain perfusion relative to right‐brain perfusion on initial assessment. For each patient, continuous perfusion values were used in a subtraction of left–right perfusion and vice versa. Individual maps were then averaged into a group subtraction map
