
Figure 5.
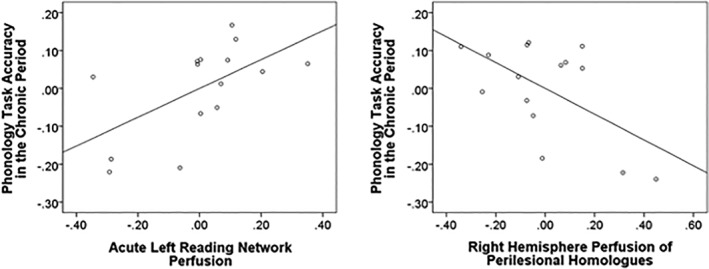
Partial regression plots for the significant (p < .05) associations between acute perfusion within the left reading network (left plot), the right reading network (right plot), and chronic ability to perform rhyming comparisons on pronounceable nonwords