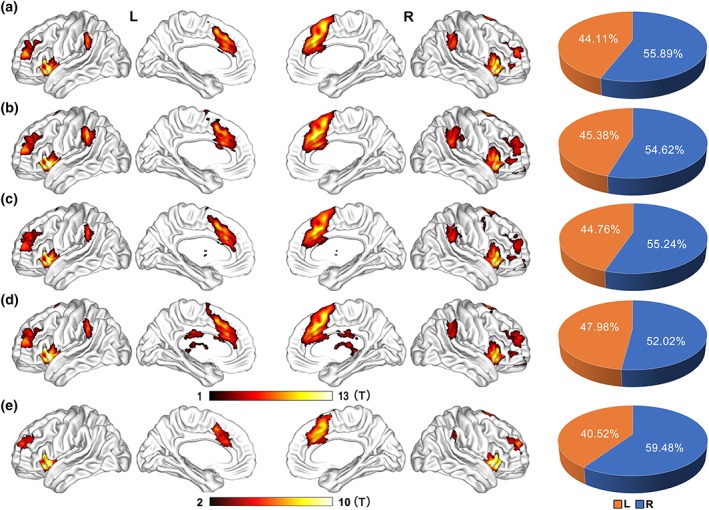
Figure 2.

Spatial distribution of the salience network as identified by functional connectivity. Mapping of the SN is reconstructed by conjunction analysis (q < 0.001, FDR corrected) of functional connectivity of three SN core hubs (the bilateral FIC and the dACC) from each run of the HCP rfMRI dataset (a–d), and from the Chinese young dataset (e). The color bar represents the t‐value of conjunction analysis. The right panels represent the volume ratio of the identified SN in the left (orange) and right (blue) hemisphere, respectively. Abbreviations: dACC, dorsal anterior cingulate cortex; FDR, false discovery rate; FIC, frontoinsular cortex; rfMRI, resting‐state functional magnetic resonance imaging; HCP, human connectome project; SN, salience network
