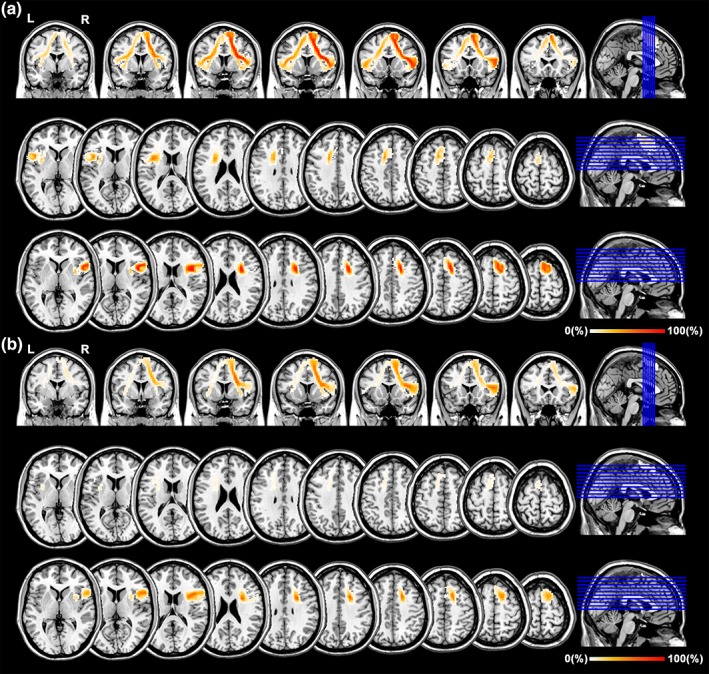
Figure 5.

Group probability map of the FIC‐dACC fiber trajectory. The group probability map is created by averaging the individual fiber trajectory of the 100 HCP subjects. The color bar represents the probability value along the FIC‐dACC fiber trajectory. Abbreviations: dACC, dorsal anterior cingulate cortex; FIC, frontoinsular cortex; HCP, human connectome project
