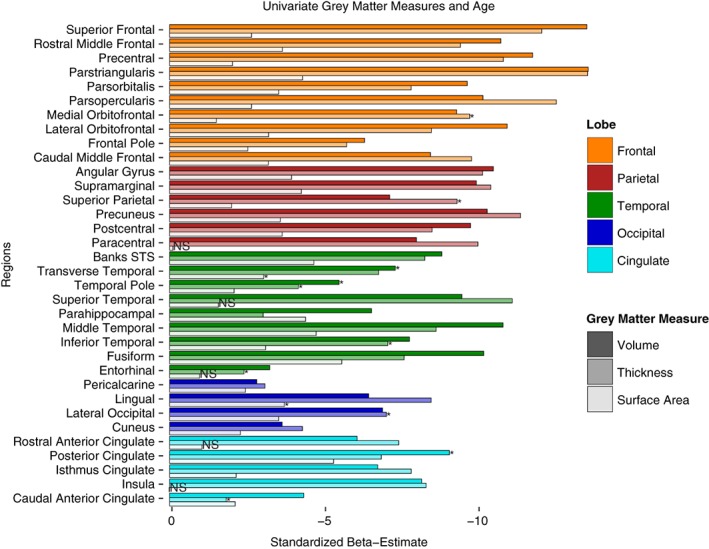
Figure 1.

Univariate results for age differences in gray matter measures of volume, thickness, and surface area by region. Values represent standardized beta‐weights from regression models containing age and sex as predictors. Larger estimates represent greater negative effect of age. Note: STS = superior temporal sulcus. Bars with asterisks indicate measures that show significant quadratic effects of age (beyond linear). Bars with NS indicate measures with neither linear nor quadratic age effects
