
Figure 5.
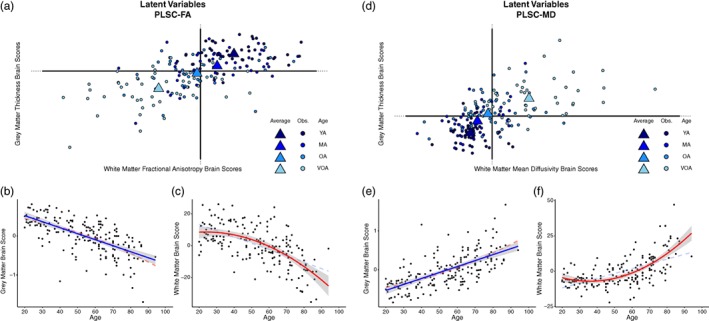
Latent variable projections and the relationship of each brain score with age for (a–c) PLSC‐FA and (d–f) PLSC‐MD. For the PLSC‐FA analysis, gray matter (GM) brain scores decrease linearly with age demonstrating that data from younger adults drive the positive side of component 1, while data from older adults drive the negative side of component 1 (illustrated in panel b). This association is also evident for white matter (WM) brain scores in a nonlinear fashion (i.e., decelerates with age; panel c). For the PLSC‐MD analysis similar linear (for gray matter in panel e) and quadratic (for WM in panel f) relationships with age are found. Scatter dots represent individual participants, triangles represent the mean of an age “group,” and blue color fades from dark to light blue represents younger to older adults, respectively to illustrate the age effect. Both linear and nonlinear regression lines are illustrated on the scatterplots, with the more significant fit denoted with bold solid lines, and the lower fitting line denoted by faded dashed lines. Note: YA, younger adults; MA = middle‐aged adults; OA = older adults; VOA = very old adults