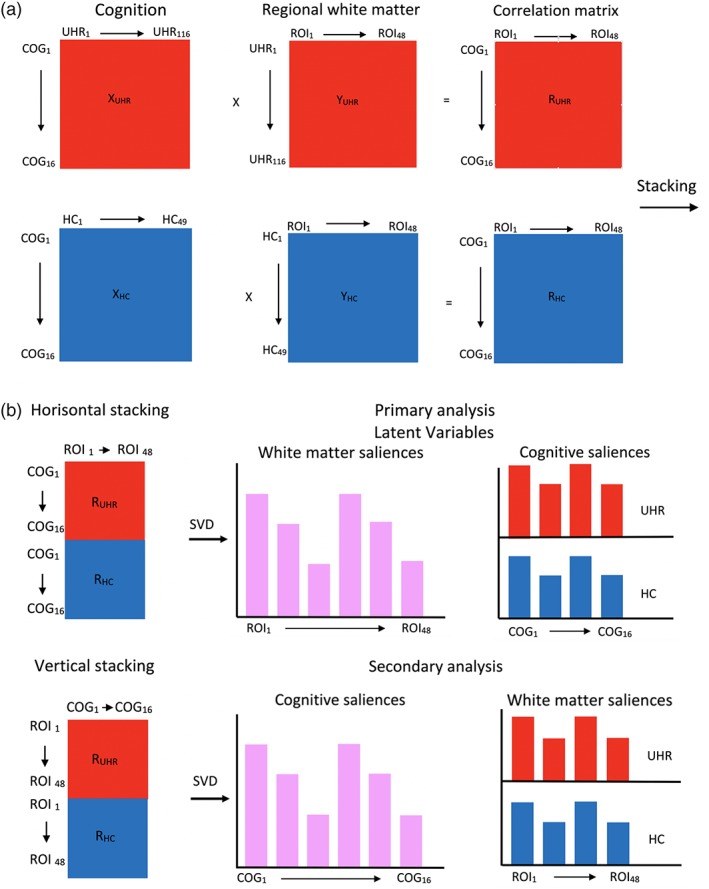
Figure 1.

PLS‐C for between‐group analysis. We included 16 cognitive functions and mean FA values of 48 WM‐regions. First, a correlation matrix (R) was computed between cognitive functions and FA data (Figure 1a. These correlation matrixes were calculated for each group (UHR and HC) and stacked horizontal and vertically (Figure 1b). When stacked horizontally, we examined between‐group differences in patterns of cognitive functions, associated with a shared pattern of regional FA (“primary analysis”). Reversely when stacked vertically, we examined between‐group differences in patterns of regional FA, associated with a shared pattern of cognitive functions (“secondary analysis”). In next step, the correlation matrixes were decomposed using singular value decomposition (SVD) to obtain latent variables (LVs). LVs express the maximum covariance between patterns of cognitive functions and group‐specific regional FA. All LVs combined completely describe the covariance matrix (100%). However, in our study we were interested in LVs, that captured the part of the covariance matrix describing the differences between UHR‐individuals and healthy controls. If this difference is evident enough, then the LV is significant (UHR‐individuals show a different association between cognitive functions and regional FA compared to healthy controls). The contribution of each of the cognitive functions and ROIs to the latent variable can be determined by projecting a significant LV back to the original variables. These projections are known as saliences. We used the two‐group PLS‐C analysis (see Jessen et al. (2018)) in an extended version to analyze the interaction‐effects in the first step of the analysis. Detailed explanation of the extra shuffling across groups during the permutations testing for interaction is illustrated in Figure S2. The second step of analysis, involving unpaired shuffling in the permutations testing, can be performed to test correlation‐effects. Abbreviations: COG, cognitive outcomes; FA, fractional anisotropy; FSL, FMRIB Software Library; HCs, Healthy controls; JHU, John Hopkins University; R, cross‐block correlation matrix; ROI, region of interest; SV, singular value; SVD, singular value decomposition; UHR, ultra‐high risk of psychosis; X, matrix of ROI FA values; Y, matrix of cognitive outcomes [Color figure can be viewed at http://wileyonlinelibrary.com]
