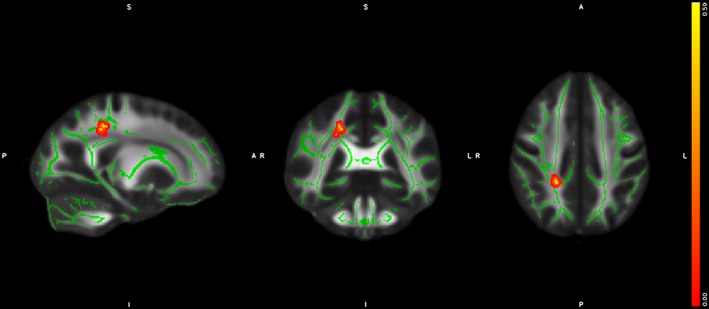
Figure 2.

Voxel‐based between‐group difference on FA. The results from the univariate TBSS GLM‐analyses, revealing significant lower FA in UHR‐individuals compared to HC in the right superior longitudinal fasciculus and right cingulate gyrus. The cluster is enhanced for visualization using TBSS_fill and highlighted in red‐yellow colors and projected on the mean study‐specific FA‐skeleton template (green color). Abbreviations: FA, fractional anisotropy; GLM, general linear modeling; HCs, healthy controls; TBSS, tract‐based spatial statistics; UHR, ultra‐high risk of psychosis; WM, white matter [Color figure can be viewed at http://wileyonlinelibrary.com]
