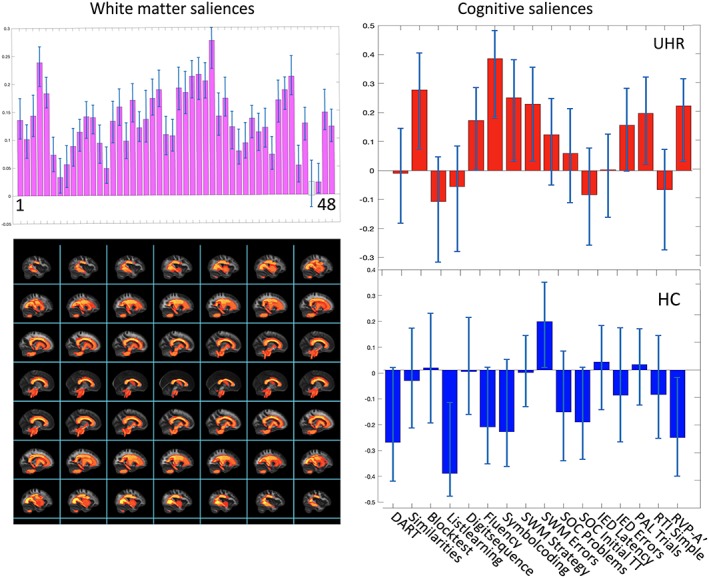
Figure 3.

Primary PLS‐C analysis. The results from the primary PLS‐C analysis, illustrating LV1. Left column displays the White matter FA‐saliences of the 48 ROIs in purple bars. Bars colored gray does not contribute reliably to the positive correlation between white matter FA and cognitive functions. Confidence intervals are marked with light‐blue lines in each bar. Below, the regions with significant interaction‐effect is projected on a standard brain derived from JHU WM‐atlas. In the right column, the saliences of the 16 cognitive functions associated with the pattern of regional WM FA are displayed and stacked for each group separately, highlighted in red for UHR‐individuals and in blue for HC. Confidence intervals that does not cross zero indicates cognitive functions which contributes reliably to the pattern. If a bar turns upward from zero, the cognitive function is positively correlated to the pattern of white matter saliences, and is negative correlated if turning downward. Cognitive test where a lower score is better were reversed for the PLS‐C analysis. For identifying the labels of the 48 ROIs displayed by numbers (1–48), see Text S2. Abbreviations: FA, fractional anisotropy; HCs, healthy controls; JHU, John Hopkins University; LV, latent variable; ROI, region of interest; UHR, ultra‐high risk of psychosis; WM, white matter [Color figure can be viewed at http://wileyonlinelibrary.com]
