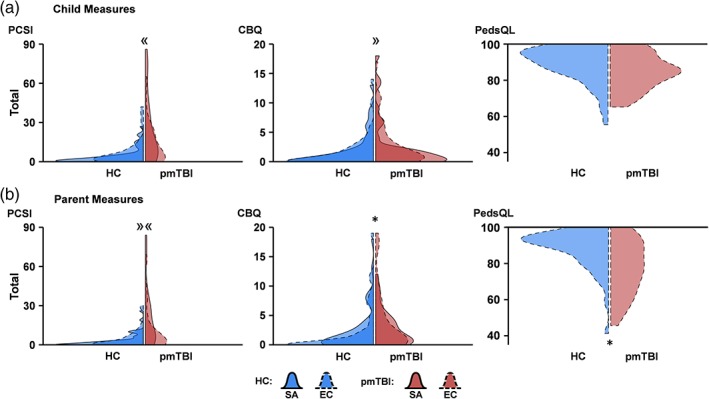
Figure 2.

Violin plot distribution of clinical measures. Violin plots showing distributions of primary clinical measures for healthy controls (HC; blue shading) and pediatric mild traumatic brain injury patients (pmTBI; red shading) at sub‐acute (SA; solid line) and early chronic (EC; dashed line) visits. The darker color denotes where the SA and EC distributions overlapped, whereas the lighter color denotes where the SA (light color with solid line) or EC (light color with dashed line) distribution was unique. Data are plotted relative to the densest point among the four distributions in each panel. Self‐ (a) and parent‐report (b) measures include the Post‐Concussion Symptom Inventory (PCSI), Children's Behavioral Questionnaire (CBQ), and Pediatric Quality of Life Inventory (PedsQL; EC only). Significant main effects of group are denoted with an asterisk (*), while significant interactions are denoted by directional guillemets (« = group differences at SA only; » = group differences at EC only; »« = differences in magnitude across SA and EC visits) [Color figure can be viewed at http://wileyonlinelibrary.com]
