Figure 4.

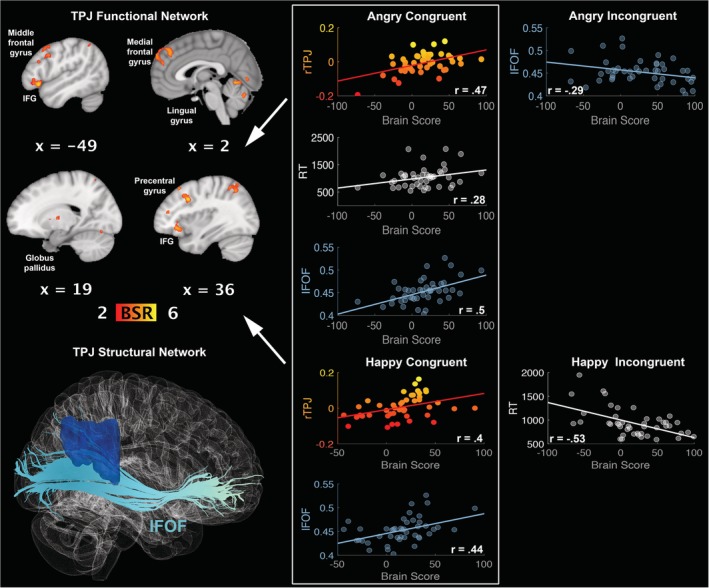
LV1: functional connections with right temporoparietal junction (rTPJ) and structural/behaviour PLS results. (Top left panel) A pattern of correlated whole‐brain activity, (bottom left panel) structural network: right inferior fronto‐occipital fasciculus (IFOF). (Top right panel) During angry congruent conditions, correlations between activity in rTPJ seed and brain scores representing network activity displayed in the top left panel, with positive correlation for FA in the IFOF, and positive correlation for reaction times. (Bottom right panel) During happy congruent conditions, correlations between activity in rTPJ seed and brain scores representing network activity displayed in the top left panel, with positive correlation for FA in the IFOF. rTPJ seed activity is displayed in percent signal change and reaction times are displayed in milliseconds. BSR threshold is set at 2 (p < 0.05), for visualisation purposes; however, reported whole‐brain activity is set at BSR 3 (p < 0.001). All results display significant correlations based on 95% confidence intervals calculated from the bootstrap procedure; for further details, including nonsignificant results, see Supplementary Materials Figure S6 [Color figure can be viewed at http://wileyonlinelibrary.com]
