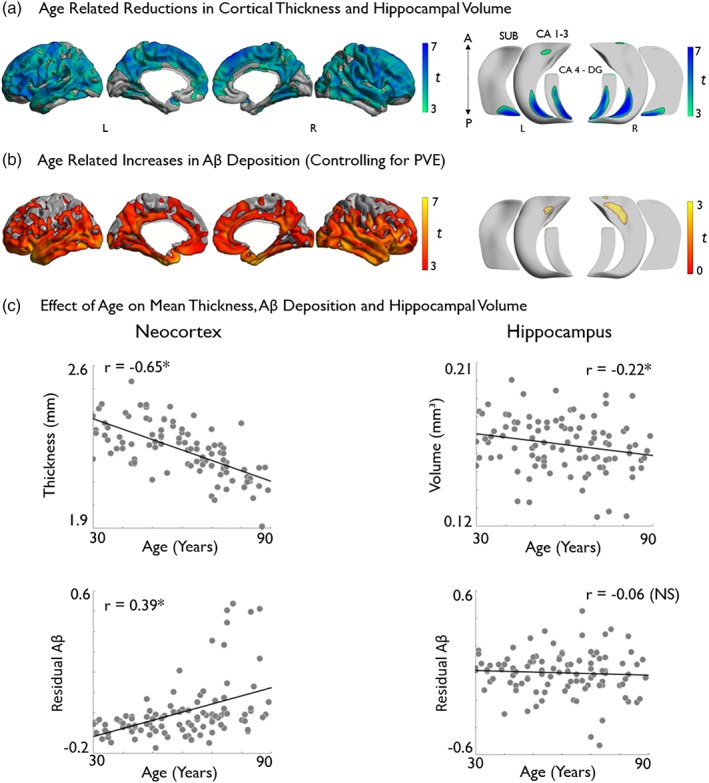
Figure 1.

Analysis of gray matter morphology and Aβ deposition (normalized by cerebellar gray matter and controlled for CSF‐PVE) along neocortical (left) and hippocampal subfield (right) surfaces. Effects of age on (a) cortical thickness and hippocampal volume across all subfields and (b) on Aβ deposition. Models controlled for sex and education. Age‐related increases are shown in warm and decreases in cold colors. Regions significant at a two‐tailed p FDR < .05 are shown with black outlines, uncorrected trends relating to increased hippocampal Aβ are shown in semi‐transparent (b, bottom right). Correlations between age and markers of brain aging are displayed in (c). *Denotes statistical significance. NS, nonsignificant; PVE, partial volume effect [Color figure can be viewed at http://wileyonlinelibrary.com]
